Essential Metrics for US Startup Growth in 2026: A Comprehensive Guide

The 5 Key Metrics Every U.S. Startup Must Track for Growth in 2026
The landscape for U.S. startups is ever-evolving, driven by rapid technological advancements, shifting consumer behaviors, and dynamic economic forces. In 2026, the ability to not just survive but thrive will hinge on a startup’s capacity to precisely measure, analyze, and act upon critical data. Gone are the days when gut feelings alone could guide a burgeoning enterprise to success. Today, data-driven decision-making is paramount, and understanding the right startup growth metrics is the bedrock of sustainable expansion.
This comprehensive guide delves into the five most crucial metrics that every U.S. startup must rigorously track to ensure robust growth and competitive advantage in the coming year. We’ll explore why these metrics are vital, how to calculate them, and most importantly, how to leverage the insights they provide to propel your business forward.
Why Metrics Matter: The Foundation of Startup Success
Before we dive into the specific metrics, it’s essential to understand the fundamental role they play. Metrics are not just numbers; they are the narrative of your business, telling you what’s working, what’s not, and where opportunities lie. For U.S. startups, especially in a competitive market, these insights are invaluable.
- Clarity and Focus: Metrics provide a clear picture of your business health, allowing you to focus resources on areas that yield the highest impact.
- Informed Decision-Making: They replace assumptions with data, leading to more strategic and effective choices regarding product development, marketing, sales, and operations.
- Accountability: Well-defined metrics create accountability within your team, as everyone can see the impact of their efforts on tangible results.
- Investor Confidence: For startups seeking funding, robust metric tracking demonstrates a deep understanding of your business and its potential, instilling confidence in potential investors.
- Early Problem Detection: Falling metrics can act as an early warning system, allowing you to pivot or adjust your strategy before minor issues escalate into major problems.
In 2026, with increasing market volatility and heightened competition, the ability to interpret and respond to these startup growth metrics will differentiate the market leaders from those left behind.
Metric 1: Customer Acquisition Cost (CAC)
What it is: Customer Acquisition Cost (CAC) is the total cost associated with convincing a potential customer to buy your product or service. This includes all sales and marketing expenses over a specific period, divided by the number of new customers acquired during that same period.
Why it’s crucial for U.S. Startups in 2026: In an increasingly crowded digital landscape, acquiring new customers can be incredibly expensive. Understanding your CAC is foundational for gauging the efficiency of your marketing and sales efforts. For U.S. startups, where competition for consumer attention is fierce and advertising costs can be high, optimizing CAC is directly linked to profitability and scalability. A high CAC without a corresponding high customer lifetime value can quickly lead to an unsustainable business model. In 2026, with privacy regulations tightening and ad platforms evolving, startups need to be acutely aware of how much they’re spending to bring in each new user.
How to calculate it:
CAC = (Total Sales & Marketing Expenses) / Number of New Customers Acquired
Example: If your startup spent $10,000 on sales and marketing in a month and acquired 100 new customers, your CAC would be $100.
Leveraging the insight:
- Identify Cost-Effective Channels: Break down your CAC by channel (e.g., social media ads, content marketing, referrals) to identify which ones are most efficient.
- Optimize Campaigns: Use CAC to evaluate the performance of specific campaigns and adjust your spending to improve efficiency.
- Pricing Strategy: Ensure your pricing strategy can comfortably cover your CAC and still generate a profit.
- Improve Conversion Rates: A higher conversion rate means more customers for the same marketing spend, thus lowering CAC. Focus on optimizing your sales funnel.
Metric 2: Customer Lifetime Value (CLTV or LTV)
What it is: Customer Lifetime Value (CLTV) is the prediction of the total revenue a business can expect to generate from a single customer account throughout the entire duration of their relationship.
Why it’s crucial for U.S. Startups in 2026: CLTV is arguably one of the most powerful startup growth metrics because it shifts the focus from one-time transactions to long-term customer relationships. For U.S. startups, particularly those with subscription models or recurring revenue, a high CLTV indicates a healthy, sustainable business. It helps you understand how much you can afford to spend on acquiring a customer (your CAC) and still be profitable. In 2026, as customer loyalty becomes a significant differentiator, maximizing CLTV through exceptional service and product evolution will be key to outpacing competitors.

How to calculate it (simplified version):
CLTV = (Average Purchase Value) x (Average Purchase Frequency) x (Average Customer Lifespan)
Example: If a customer spends $50 per month, makes 12 purchases a year, and stays with your service for 3 years: CLTV = $50 x 12 x 3 = $1,800.
Leveraging the insight:
- Optimize Marketing Spend: A higher CLTV justifies a higher CAC, allowing you to invest more aggressively in acquiring valuable customers. The ideal ratio of CLTV to CAC is often cited as 3:1 or higher.
- Improve Customer Retention: Focus on strategies to increase customer loyalty and extend their lifespan with your product or service.
- Personalized Experiences: Use CLTV data to identify your most valuable customer segments and tailor experiences or offers to them.
- Upselling and Cross-selling: Develop strategies to encourage existing customers to purchase more or try complementary products, increasing their average purchase value.
Metric 3: Churn Rate
What it is: Churn rate (or customer attrition rate) is the rate at which customers stop doing business with an entity. It’s typically expressed as a percentage over a given period (e.g., monthly, quarterly, annually).
Why it’s crucial for U.S. Startups in 2026: Churn is the silent killer of many startups. While acquiring new customers is exciting, if you’re losing them just as fast, your growth is an illusion. For U.S. startups, especially those with recurring revenue models (SaaS, subscriptions), managing churn is paramount. In 2026, as consumers have more choices than ever and are quick to switch providers for better value or experience, a high churn rate can quickly erode your customer base and profitability. Understanding and actively working to reduce churn directly impacts your CLTV and the overall health of your business, making it a non-negotiable startup growth metric.
How to calculate it:
Churn Rate = (Number of Customers Lost During Period) / (Number of Customers at Beginning of Period) x 100
Example: If you started the month with 1,000 customers and lost 50, your churn rate is (50 / 1,000) x 100 = 5%.
Leveraging the insight:
- Identify Causes of Churn: Conduct exit surveys, analyze usage data, and gather feedback to understand why customers are leaving.
- Improve Product/Service: Address pain points identified through churn analysis to enhance your offering.
- Proactive Engagement: Implement customer success initiatives to engage with at-risk customers before they churn.
- Targeted Retention Campaigns: Offer incentives, personalized support, or exclusive content to retain valuable customers.
Metric 4: Monthly Recurring Revenue (MRR) or Annual Recurring Revenue (ARR)
What it is: Monthly Recurring Revenue (MRR) is the predictable recurring revenue a company expects to receive every month. Annual Recurring Revenue (ARR) is the normalized measure of predictable recurring revenue for a year. These metrics are particularly relevant for subscription-based businesses.
Why it’s crucial for U.S. Startups in 2026: For many U.S. startups, especially in the SaaS and subscription economy, MRR/ARR is the ultimate indicator of business health and growth momentum. It provides a clear, consistent picture of your revenue stream, allowing for accurate forecasting and strategic planning. Investors scrutinize MRR/ARR because it reflects the scalability and stability of your business model. In 2026, predictable revenue streams are highly valued, and a strong, growing MRR/ARR demonstrates market fit and customer loyalty, making it an indispensable startup growth metric.
How to calculate it:
MRR = (Average Revenue Per User) x (Total Number of Active Subscribers)
ARR = MRR x 12
Example: If you have 1,000 active subscribers, each paying $20 per month: MRR = $20 x 1,000 = $20,000. ARR = $20,000 x 12 = $240,000.
Leveraging the insight:
- Forecast Revenue: MRR/ARR provides a reliable basis for financial projections and budgeting.
- Track Growth Trajectory: Monitor changes in MRR/ARR over time to understand your growth rate and identify trends.
- Evaluate Product Tiers: Analyze MRR/ARR contributions from different pricing tiers to optimize your product offerings.
- Identify Expansion Opportunities: Growth in MRR/ARR can come from new customers (New MRR), existing customers upgrading (Expansion MRR), or customers reactivating (Reactivation MRR). Track these components to understand where your growth is coming from.
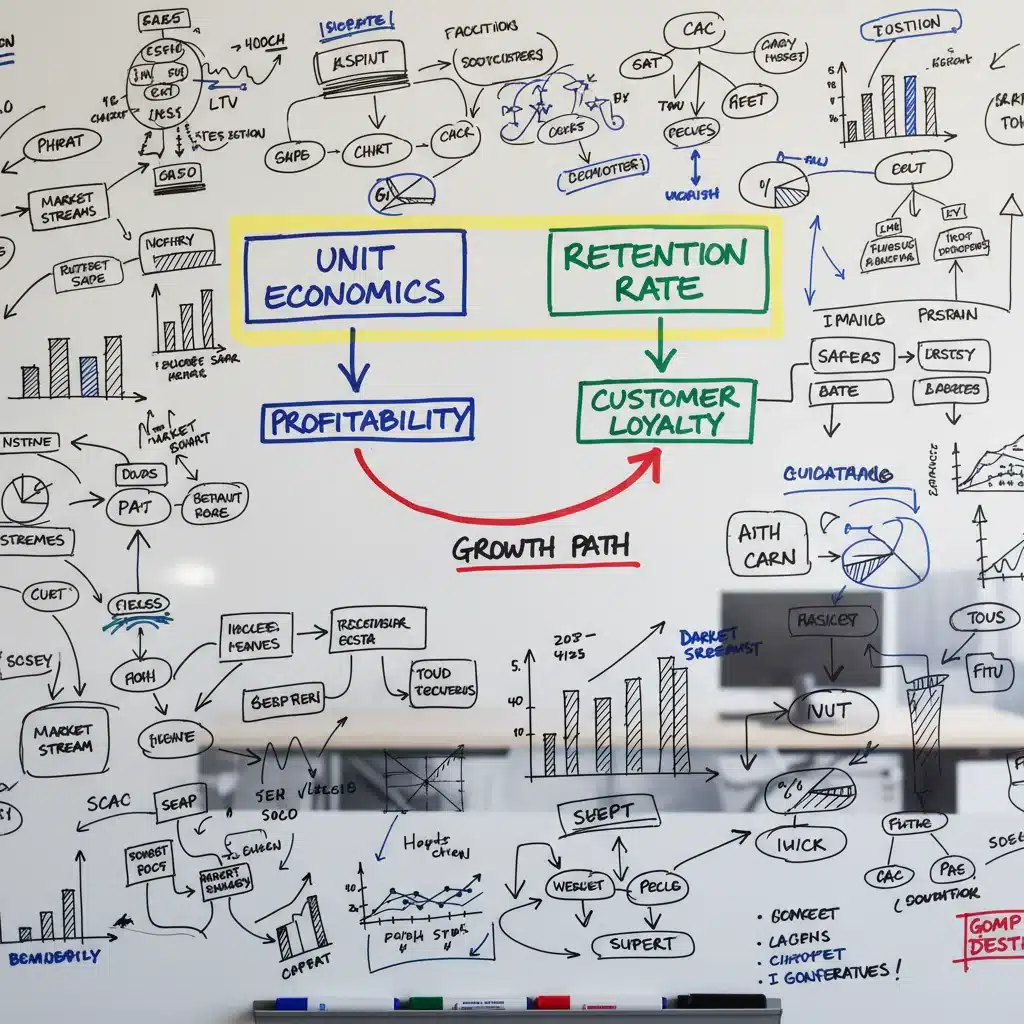
Metric 5: Unit Economics
What it is: Unit economics refers to the direct revenues and costs associated with a business’s fundamental unit. The "unit" can vary depending on the business model – it could be a single customer, a single product, a single transaction, or even a specific service delivery. It helps determine the profitability of each unit.
Why it’s crucial for U.S. Startups in 2026: While the previous metrics provide a macro view, unit economics offers a granular understanding of whether your business model is fundamentally sound at its core. For U.S. startups, especially those scaling rapidly, understanding unit economics prevents "growth at all costs" pitfalls, where increasing revenue might mask underlying unprofitability. In 2026, investors are increasingly scrutinizing profitability and sustainable growth over sheer user acquisition. Positive unit economics signals a viable and scalable business, making it a critical startup growth metric for attracting investment and achieving long-term success.
How to calculate it (example for a customer unit):
Revenue Per Unit (e.g., CLTV) – Cost Per Unit (e.g., CAC + Cost of Goods Sold per customer) = Profit Per Unit
Example: If your CLTV is $1,800, your CAC is $100, and the direct cost to serve that customer over their lifetime is $300: Profit Per Unit = $1,800 – ($100 + $300) = $1,400.
Leveraging the insight:
- Validate Business Model: Ensures that each customer or transaction is profitable, proving the viability of your business model.
- Guide Scaling Decisions: If your unit economics are positive, you can confidently scale your operations, knowing that each new unit will contribute to overall profitability.
- Optimize Operations: Identify areas where costs can be reduced or revenue per unit can be increased, without sacrificing quality.
- Investor Pitching: Demonstrating strong unit economics is a powerful signal to investors that your startup has a clear path to profitability and sustainable growth.
Beyond the Numbers: The Art of Interpretation and Action
Tracking these five startup growth metrics is only half the battle. The real value lies in your ability to interpret them and translate those insights into actionable strategies. Here are some best practices for U.S. startups in 2026:
1. Establish Baselines and Goals: Before you can improve, you need to know where you stand. Establish current baselines for each metric and set realistic, measurable goals for improvement. For example, aim to reduce CAC by 10% or increase CLTV by 15% within the next quarter.
2. Monitor Trends, Not Just Snapshots: A single data point can be misleading. Look for trends over time. Is your CAC steadily increasing? Is your churn rate creeping up? Trends reveal underlying issues or successes that a single month’s data might miss.
3. Segment Your Data: Don’t treat all customers or all marketing channels the same. Segment your metrics by customer type, acquisition channel, product line, or geographic region. You might find that your CAC is excellent for one segment but disastrous for another. This granular view is essential for targeted optimization.
4. Integrate Your Data Sources: Connect your CRM, marketing automation, accounting software, and analytics platforms. A unified view of your data will provide a more holistic understanding of your business performance and make metric tracking much more efficient.
5. Foster a Data-Driven Culture: Encourage every team member, from product development to customer support, to understand and engage with these metrics. When everyone understands how their work impacts key business outcomes, it fosters a more aligned and effective organization. Regular dashboards and transparent reporting can help achieve this.
6. A/B Test and Experiment Continuously: Use your metrics to inform experiments. Want to reduce churn? Try a new onboarding flow and measure its impact. Want to lower CAC? Test different ad creatives or landing pages. Data-driven experimentation is the engine of continuous improvement.
7. Beware of Vanity Metrics: While impressive, metrics like total website visitors or social media followers often don’t directly translate to business growth. Focus on actionable metrics that tell you about revenue, costs, and customer behavior. The five metrics discussed here are all highly actionable.
8. Adapt to Market Changes: The U.S. market in 2026 will be dynamic. Be prepared to adjust your metric focus or even discover new relevant metrics as your business evolves and the market shifts. What’s critical today might be less so tomorrow, and vice-versa.
The Synergy of Startup Growth Metrics
It’s crucial to understand that these startup growth metrics are not isolated. They interact and influence each other significantly.
- A low CAC is great, but if your CLTV is even lower, you have a problem.
- A high churn rate will directly depress your CLTV and make it harder to grow your MRR/ARR.
- Strong unit economics are often a result of a healthy balance between CAC, CLTV, and churn.
Think of them as a dashboard for a complex machine. You wouldn’t just look at the speedometer; you’d also check the fuel gauge, oil pressure, and engine temperature. Similarly, a holistic view of these metrics provides the most accurate picture of your startup’s health and potential for growth.
Tools for Tracking and Analysis
In 2026, U.S. startups have access to an unprecedented array of tools to help track and analyze these critical metrics:
- Analytics Platforms: Google Analytics 4, Mixpanel, Amplitude, Segment for user behavior and website performance.
- CRM Systems: Salesforce, HubSpot, Zoho CRM for managing customer relationships and sales pipelines, which feed into CAC and CLTV calculations.
- Marketing Automation Platforms: Marketo, Pardot, ActiveCampaign for tracking campaign performance and contributing to CAC data.
- Subscription Management Software: Chargebee, Stripe Billing, Recurly for automating billing, tracking MRR/ARR, and churn.
- Business Intelligence (BI) Tools: Tableau, Power BI, Looker (Google Data Studio) for consolidating data from various sources and creating comprehensive dashboards.
- Customer Feedback Platforms: SurveyMonkey, Typeform, Intercom for gathering qualitative data that can explain quantitative metric shifts, especially related to churn.
Investing in the right tools and having the expertise to use them effectively will be a significant competitive advantage for U.S. startups aiming for sustained growth in 2026.
Conclusion: Charting Your Course for Growth in 2026
For U.S. startups, 2026 presents both immense opportunities and significant challenges. The businesses that will rise to the top are those that embrace a data-first approach, meticulously tracking and optimizing their performance. By focusing on Customer Acquisition Cost (CAC), Customer Lifetime Value (CLTV), Churn Rate, Monthly/Annual Recurring Revenue (MRR/ARR), and Unit Economics, you equip your startup with the necessary insights to make strategic decisions, attract investment, and build a resilient, scalable enterprise.
These five startup growth metrics are more than just numbers; they are your compass, guiding you through the complexities of the market, helping you identify true growth, and enabling you to adapt and innovate with confidence. Make them a core part of your operational rhythm, and you’ll be well-positioned to achieve remarkable success in the dynamic U.S. startup ecosystem of 2026 and beyond. Start tracking, start analyzing, and start growing. Your future success depends on it.