Data-Driven Decision Making: 3 Operational Analytics Tools for US Businesses in 2026

In an increasingly competitive and data-rich landscape, US businesses are constantly seeking innovative ways to gain an edge. The year 2026 promises to be a pivotal moment for data-driven decision making, with the widespread adoption of advanced Operational Analytics Tools. These tools are no longer just a luxury; they are a necessity for organizations aiming to optimize processes, enhance efficiency, and respond dynamically to market changes. This comprehensive guide will explore the profound impact of operational analytics, delve into the criteria for selecting the best tools, and highlight three leading platforms poised to dominate the US market in 2026.
The Imperative of Operational Analytics in 2026
The business world of 2026 is characterized by unprecedented data volumes, accelerated market cycles, and an unrelenting demand for efficiency. Traditional business intelligence (BI) often focuses on historical data, providing insights into what has already happened. While valuable, this retrospective view is insufficient for the real-time demands of modern operations. This is where Operational Analytics Tools step in, bridging the gap between historical analysis and immediate action.
Operational analytics involves collecting, processing, and analyzing data generated from day-to-day business operations. This includes everything from supply chain logistics and manufacturing processes to customer interactions, sales pipelines, and financial transactions. The goal is to provide real-time or near real-time insights that enable frontline managers and operational teams to make informed decisions quickly, identify bottlenecks, optimize resource allocation, and proactively address emerging issues.
Why US Businesses Need Operational Analytics Now More Than Ever
- Accelerated Decision-Making: In 2026, the speed of business will be faster than ever. Operational analytics empowers teams to make decisions in minutes, not days, directly impacting productivity and responsiveness.
- Enhanced Efficiency and Cost Reduction: By identifying inefficiencies, waste, and underutilized resources in real-time, businesses can streamline operations, reduce operational costs, and improve overall profitability.
- Improved Customer Experience: Understanding customer interactions and service delivery metrics in real-time allows businesses to quickly resolve issues, personalize experiences, and build stronger customer loyalty.
- Proactive Risk Management: Real-time monitoring of operational data helps in detecting anomalies and potential risks before they escalate, safeguarding business continuity and reputation.
- Competitive Advantage: Businesses that master operational analytics will be able to adapt quicker, innovate faster, and outperform competitors who rely on slower, more traditional analytical approaches.
- Scalability and Growth: As businesses expand, the complexity of their operations increases. Operational Analytics Tools provide the necessary visibility and control to manage growth effectively without compromising efficiency.
The shift towards cloud-native architectures, advanced AI/ML capabilities, and more intuitive user interfaces means that operational analytics is becoming accessible to a broader range of businesses, from agile startups to multinational corporations. The demand for skilled professionals who can leverage these tools is also skyrocketing, highlighting the growing importance of this domain.
Key Features to Look for in Operational Analytics Tools in 2026
Selecting the right Operational Analytics Tools is crucial for maximizing their impact. In 2026, businesses should prioritize platforms that offer a robust set of features designed to handle the complexities of modern data environments and operational demands. Here are the essential capabilities to consider:
1. Real-time Data Ingestion and Processing
The cornerstone of operational analytics is the ability to ingest and process data as it is generated. Look for tools that support:
- Streaming Data Connectors: Seamless integration with various data sources, including IoT devices, transactional databases, CRM systems, ERP systems, and cloud applications.
- Low-Latency Processing: The capacity to process vast amounts of data with minimal delay, ensuring that insights are genuinely real-time.
- Scalability: The ability to scale data ingestion and processing capabilities up or down based on data volume fluctuations, without performance degradation.
2. Advanced Analytics and AI/ML Integration
Beyond basic reporting, modern Operational Analytics Tools leverage advanced techniques to uncover deeper insights:
- Predictive Analytics: Using historical data and machine learning algorithms to forecast future operational trends, demand, and potential issues. This enables proactive decision-making.
- Prescriptive Analytics: Not just predicting what will happen, but recommending specific actions to optimize outcomes.
- Anomaly Detection: AI-powered algorithms that automatically identify unusual patterns or deviations from normal operational behavior, signaling potential problems.
- Root Cause Analysis: Tools that help pinpoint the underlying causes of operational issues, rather than just identifying symptoms.
3. Customizable Dashboards and Visualizations
Insights are only valuable if they are easily understood and actionable. Effective tools provide:
- Intuitive User Interface (UI): A clean, user-friendly interface that allows users to quickly navigate and find the information they need.
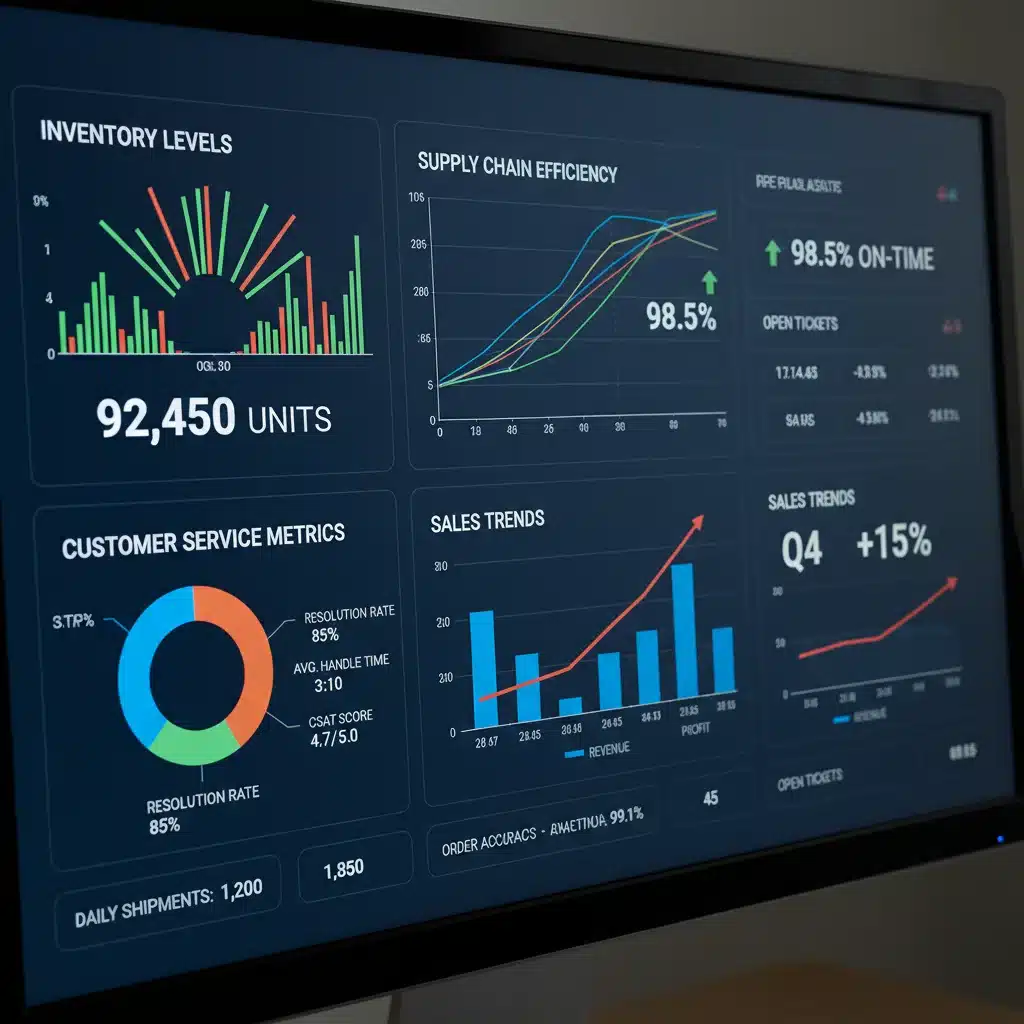
- Customizable Dashboards: The ability to create personalized dashboards tailored to specific roles, departments, or operational areas, displaying relevant KPIs and metrics.
- Interactive Visualizations: Dynamic charts, graphs, and maps that allow users to drill down into data, explore trends, and identify correlations.
4. Collaboration and Alerting Capabilities
Operational decisions often require collaboration across teams. Look for features that facilitate this:
- Real-time Alerts and Notifications: Automated alerts based on predefined thresholds or detected anomalies, delivered via email, SMS, or integrated communication platforms.
- Collaboration Features: The ability to share dashboards, reports, and insights with colleagues, add comments, and track discussions within the platform.
- Integration with Workflow Tools: Seamless integration with project management, ticketing, and other operational workflow tools to streamline the transition from insight to action.
5. Data Governance and Security
With increasing data privacy regulations and security threats, robust data governance is paramount:
- Role-Based Access Control (RBAC): Granular control over who can access what data and functionalities within the platform.
- Data Encryption: Encryption of data at rest and in transit to protect sensitive operational information.
- Compliance Features: Adherence to industry-specific regulations (e.g., HIPAA, GDPR, CCPA) and best practices for data privacy and security.
- Audit Trails: Comprehensive logging of all data access and modifications for accountability and compliance.
6. Scalability and Integration Ecosystem
A tool’s long-term value depends on its ability to grow with your business and integrate with your existing tech stack:
- Cloud-Native Architecture: Leveraging the scalability, reliability, and cost-effectiveness of cloud infrastructure.
- Extensive API Access: Open APIs that allow for custom integrations with other enterprise systems and applications.
- Ecosystem of Connectors: A wide range of pre-built connectors to popular data sources and business applications.
By carefully evaluating these features, US businesses can select Operational Analytics Tools that not only meet their current needs but also position them for future success in 2026 and beyond.
Top 3 Operational Analytics Tools for US Businesses in 2026
Based on market trends, technological advancements, and projected adoption rates, here are three Operational Analytics Tools that are expected to be frontrunners for US businesses in 2026:
1. Datadog Operational Analytics
While often recognized for its robust monitoring capabilities, Datadog has significantly expanded its operational analytics offerings, making it a powerful contender for businesses seeking comprehensive visibility across their entire tech stack. Datadog’s strength lies in its ability to unify metrics, traces, logs, and user experience data into a single, cohesive platform, providing a 360-degree view of operational health.
Key Strengths for 2026:
- Unified Observability: Datadog excels at bringing together data from diverse sources – applications, infrastructure, networks, and user activity – into a unified view. This holistic approach is crucial for understanding complex interdependencies in modern IT environments.
- Real-time Anomaly Detection and Alerting: Leveraging advanced machine learning, Datadog can automatically detect anomalies in operational data, such as sudden spikes in error rates or performance degradation, and trigger immediate alerts to relevant teams. This proactive approach minimizes downtime and mitigates potential issues.
- Log Management and Analytics: Its powerful log management capabilities allow users to ingest, process, and analyze vast volumes of log data in real-time, enabling quick troubleshooting and identification of root causes for operational incidents.
- Customizable Dashboards and Workflows: Datadog offers highly customizable dashboards and drag-and-drop widgets, allowing operational teams to visualize KPIs and metrics that are most relevant to their specific roles and responsibilities. Its workflow integrations further streamline incident response.
- Cloud-Native Focus: As more US businesses embrace cloud and hybrid cloud strategies, Datadog’s cloud-native architecture and extensive integrations with AWS, Azure, Google Cloud, and Kubernetes make it an ideal choice for monitoring and analyzing dynamic cloud environments.
Ideal for:
Tech-intensive businesses, e-commerce platforms, SaaS companies, and organizations with complex microservices architectures that require deep visibility into their IT operations and application performance.
2. Tableau (with Salesforce Einstein Analytics)
Tableau, now part of Salesforce, has long been a leader in business intelligence and data visualization. Its evolution, particularly with the integration of Salesforce Einstein Analytics (now part of CRM Analytics), positions it as a formidable operational analytics tool. Tableau’s strength lies in its intuitive visual interface, powerful data exploration capabilities, and the added layer of AI-driven insights from Einstein.
Key Strengths for 2026:
- Exceptional Data Visualization: Tableau’s core strength remains its ability to transform complex operational data into beautiful, interactive, and easy-to-understand visualizations. This is critical for conveying insights to a wide range of stakeholders, from executives to frontline staff.
- Self-Service Analytics: It empowers business users, even those without deep technical skills, to explore data, create their own reports, and answer operational questions independently, fostering a culture of data literacy.
- Salesforce Integration: For businesses heavily invested in the Salesforce ecosystem, this integration is a game-changer. It allows for seamless analysis of CRM data alongside other operational data, providing a unified view of customer journeys, sales performance, and service operations.
- Einstein AI Capabilities: The inclusion of Einstein Analytics brings powerful AI and machine learning capabilities directly into the operational workflow. This includes predictive forecasting for sales and demand, prescriptive recommendations for customer service, and automated anomaly detection, all designed to make operational insights more actionable.
- Extensive Data Connectivity: Tableau connects to virtually any data source, whether on-premise databases, cloud data warehouses, or various business applications, ensuring that all relevant operational data can be brought together for analysis.
Ideal for:
Sales-driven organizations, customer service centers, marketing teams, and any business that benefits from strong visual data exploration and AI-powered insights, especially those already using Salesforce.
3. Microsoft Power BI (with Azure Synapse Analytics)
Microsoft’s Power BI has established itself as a dominant force in the business intelligence market, and its integration with Azure Synapse Analytics solidifies its position as a powerful operational analytics solution for 2026. This combination provides an end-to-end platform for data warehousing, big data analytics, and interactive reporting, all within the familiar Microsoft ecosystem.
Key Strengths for 2026:
- Cost-Effective and Accessible: Power BI offers a highly competitive pricing model, often included with Microsoft 365 subscriptions, making it accessible to a wide range of businesses. Its familiar interface reduces the learning curve for users already accustomed to Microsoft products.
- Deep Integration with Microsoft Ecosystem: For US businesses heavily invested in Microsoft technologies (Azure, SQL Server, Excel, SharePoint, Dynamics 365), Power BI and Azure Synapse offer unparalleled integration, streamlining data flow and analysis across the entire enterprise.
- Scalable Data Warehousing with Azure Synapse: Azure Synapse Analytics provides a unified platform for enterprise data warehousing and big data analytics at scale. This means businesses can ingest, process, and analyze massive volumes of operational data, from transactional records to IoT sensor data, with high performance.
- Advanced Analytics and AI/ML Workloads: Synapse integrates with Azure Machine Learning, allowing data scientists to build and deploy advanced AI models for predictive maintenance, demand forecasting, and operational optimization directly within the analytics pipeline. Power BI then visualizes these AI-driven insights.
- Robust Data Governance and Security: Leveraging Azure’s enterprise-grade security and compliance features, the Power BI and Synapse combination offers strong data governance, role-based access control, and data encryption, meeting stringent regulatory requirements.
Ideal for:
Large enterprises, organizations with significant existing Microsoft investments, and businesses requiring a scalable, integrated platform for both operational and strategic data analysis, especially those dealing with big data volumes.

Implementing Operational Analytics: Best Practices for US Businesses
Choosing the right Operational Analytics Tools is just the first step. Successful implementation requires a strategic approach and adherence to best practices:
1. Define Clear Objectives and KPIs
Before diving into tool selection or data integration, clearly define what operational questions you want to answer and what key performance indicators (KPIs) you need to track. This will guide your data collection, analysis, and dashboard design. Focus on metrics that directly impact business outcomes, such as order fulfillment time, customer churn rate, production downtime, or inventory turnover.
2. Start Small, Scale Big
Don’t try to implement operational analytics across your entire organization all at once. Begin with a pilot project in a specific department or operational area where the impact can be clearly measured. This allows you to refine your approach, demonstrate value, and build internal champions before scaling to other areas. For example, start with optimizing a single supply chain segment or improving a specific customer service process.
3. Ensure Data Quality and Integration
Garbage in, garbage out. The accuracy and reliability of your operational insights depend entirely on the quality of your data. Invest in data governance strategies, data cleaning processes, and robust data integration frameworks. Ensure that data from disparate sources is harmonized and consistent before it’s fed into your Operational Analytics Tools.
4. Foster a Data-Driven Culture
Technology alone isn’t enough. Cultivate a culture where employees at all levels are empowered and encouraged to use data for decision-making. Provide training, communicate the benefits, and celebrate successes. Leaders must champion the use of operational analytics and integrate it into daily routines and strategic planning.
5. Focus on Actionable Insights
The primary purpose of operational analytics is to drive action. Ensure that your dashboards and reports are not just informative but also actionable. Design them to highlight critical issues, suggest next steps, and empower operational teams to make immediate improvements. Avoid information overload; focus on the most impactful insights.
6. Regularly Review and Iterate
The operational landscape is constantly evolving. Your analytics strategy should too. Regularly review the effectiveness of your Operational Analytics Tools, dashboards, and KPIs. Gather feedback from users, identify areas for improvement, and iterate on your approach. This continuous improvement cycle ensures that your analytics capabilities remain relevant and valuable.
7. Invest in Training and Skill Development
To fully leverage these sophisticated tools, your team needs the right skills. Invest in training programs for data analysts, operational managers, and even frontline staff who will interact with the dashboards. This includes training on data literacy, tool usage, and how to interpret and act on the insights generated.
The Future of Operational Analytics in the US (Beyond 2026)
Looking beyond 2026, the evolution of Operational Analytics Tools will be driven by several key trends:
- Hyper-Personalization: Analytics will become even more granular, enabling businesses to personalize operational responses down to individual customer or product levels.
- Edge Computing and IoT Integration: As IoT devices proliferate, operational analytics will increasingly move to the edge, processing data closer to its source for ultra-low-latency insights and autonomous operational responses.
- Generative AI for Insights: Generative AI will play a greater role in not just analyzing data but also in generating narratives, explanations, and even proactive recommendations for operational improvements, making insights even more accessible to non-technical users.
- Sustainability Analytics: Operational analytics will be crucial for monitoring and optimizing environmental impact, tracking carbon footprints, and ensuring sustainable supply chain practices.
- Digital Twins: The creation of digital twins – virtual replicas of physical assets, processes, or systems – will become more common, allowing for real-time simulation and optimization of operations before changes are implemented in the physical world.
These advancements will further solidify operational analytics as a cornerstone of competitive advantage for US businesses, transforming how they operate, innovate, and serve their customers.
Conclusion
The landscape of US business in 2026 will be defined by agility, efficiency, and the ability to make rapid, informed decisions. Operational Analytics Tools are the engines driving this transformation, providing the real-time insights necessary to navigate complex market dynamics and achieve sustained growth. Whether it’s the unified observability of Datadog, the visual prowess and AI of Tableau, or the integrated power of Microsoft Power BI with Azure Synapse, the right tool can unlock unprecedented operational efficiency and strategic advantage.
By understanding the critical features, selecting the best-fit platform, and adopting best practices for implementation, US businesses can harness the full potential of operational analytics. The journey towards a truly data-driven enterprise is continuous, but with these advanced tools, organizations are well-equipped to thrive in the competitive environment of 2026 and beyond, turning data into their most valuable asset.